Strategy Tester Report
AlpariUK-Demo (Build 225)
| Symbol | EURUSD (Euro vs US Dollar) | ||||
| Period | 1 Hour (H1) 2009.12.01 00:00 - 2010.01.15 22:00 (2009.12.01 - 2010.01.17) | ||||
| Model | Control points (a very crude method, the results must not be considered) | ||||
| Parameters | Magic=42008; LotSize=0.1; TP=400; SL=1800; LongComment=""SSL""; ShortComment=""SSS""; BreakEven=100; BEOffset=10; TrailStop=400; MoneyManagement=false; MaxLotSize=1.5; Risk=15; PreventPos=1; MaxOpenTrades=20; EMA=""EMA"; UseEMAFilter=false; ShortEma=19; LongEma=110; MinEmaDiverg=10; | ||||
| Bars in test | 1753 | Ticks modelled | 19953 | Modelling quality | n/a |
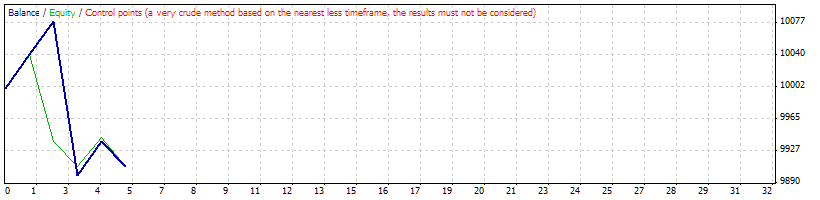
| Mismatched charts errors | 1 | ||||
| Initial deposit | 10000.00 | ||||
| Total net profit | -90.68 | Gross profit | 118.98 | Gross loss | -209.66 |
| Profit factor | 0.57 | Expected payoff | -18.14 | ||
| Absolute drawdown | 138.78 | Maximal drawdown | 192.71 (1.92%) | Relative drawdown | 1.92% (192.71) |
| Total trades | 5 | Short positions (won %) | 3 (100.00%) | Long positions (won %) | 2 (0.00%) |
| Profit trades (% of total) | 3 (60.00%) | Loss trades (% of total) | 2 (40.00%) | ||
| Largest | profit trade | 40.00 | loss trade | -180.16 | |
| Average | profit trade | 39.66 | loss trade | -104.83 | |
| Maximum | consecutive wins (profit in money) | 2 (78.98) | consecutive losses (loss in money) | 1 (-180.16) | |
| Maximal | consecutive profit (count of wins) | 78.98 (2) | consecutive loss (count of losses) | -180.16 (1) | |
| Average | consecutive wins | 2 | consecutive losses | 1 | |
| # | Time | Type | Order | Size | Price | S / L | T / P | Profit | Balance |
| 1 | 2010.01.11 19:00 | sell | 1 | 0.10 | 1.45081 | 1.46881 | 1.44681 | ||
| 2 | 2010.01.12 03:15 | t/p | 1 | 0.10 | 1.44681 | 1.46881 | 1.44681 | 39.83 | 10039.83 |
| 3 | 2010.01.12 03:15 | sell | 2 | 0.10 | 1.44673 | 1.46473 | 1.44273 | ||
| 4 | 2010.01.13 13:20 | buy | 3 | 0.10 | 1.45792 | 1.43992 | 1.46192 | ||
| 5 | 2010.01.15 03:15 | t/p | 2 | 0.10 | 1.44273 | 1.46473 | 1.44273 | 39.15 | 10078.98 |
| 6 | 2010.01.15 03:15 | sell | 4 | 0.10 | 1.44222 | 1.46022 | 1.43822 | ||
| 7 | 2010.01.15 09:15 | s/l | 3 | 0.10 | 1.43992 | 1.43992 | 1.46192 | -180.16 | 9898.82 |
| 8 | 2010.01.15 09:20 | t/p | 4 | 0.10 | 1.43822 | 1.46022 | 1.43822 | 40.00 | 9938.82 |
| 9 | 2010.01.15 09:50 | buy | 5 | 0.10 | 1.44138 | 1.42338 | 1.44538 | ||
| 10 | 2010.01.15 22:57 | close at stop | 5 | 0.10 | 1.43843 | 1.42338 | 1.44538 | -29.50 | 9909.32 |